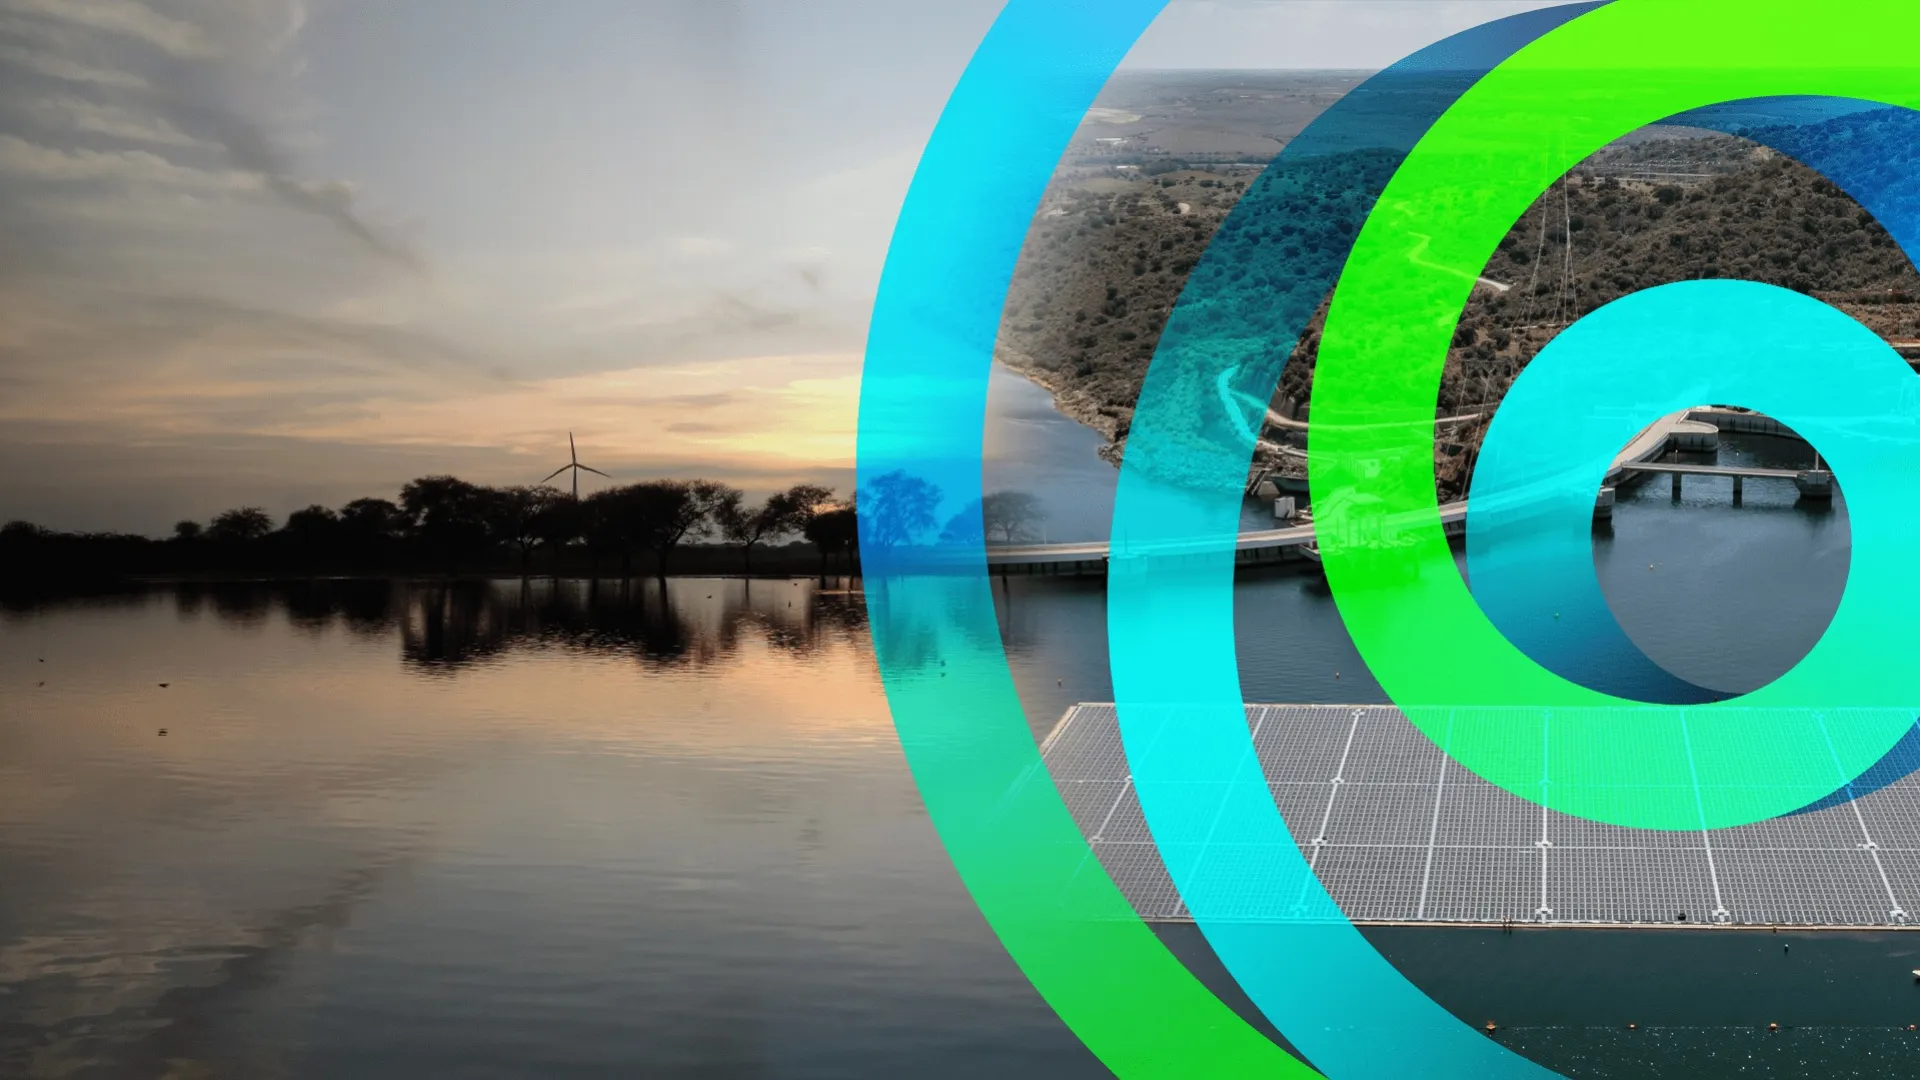
Leveraging the secular electrification investment opportunity
We are entering an era of sustained growth of power demand, and renewables are the cheapest, fastest and most scalable technology. The energy system needs more flexibility, and it is important to modernize aging network, connect demand/supply and reinforce system reliability.
In this context, EDP's 2026-28 Business Plan was designed to capture electricity demand growth driven by electrification and data centres deployment, with renewables and electricity networks at its core.
Our 2026-2028 commitments
A clean and smarter energy system at the centre of our investment worldwide
Between 2026 and 2028, we plan to invest around €12 billion to reinforce electrification and strengthen energy resilience.
Investment allocation
70%
Renewables, Clients
& Energy Management

30%
Electricity
Networks
~90% of total investment in A-rated markets
Geographic focus
35%
United States
30%
Portugal
and Spain

10%
Brazil
5%
Others
20%
Rest of Europe
We will recycle capital through a €5 billion asset rotation program and streamline the portfolio with €1 billion of target disposals in the period to fund core growth markets
Financial projections 2025-2028
| 2025 | 2026 | 2028 | 2025 - 2028 | |
|---|---|---|---|---|
| EBITDA (€ Bn) | 4.9 | 4.9 - 5.0 | 5.2 | +6% |
| Net Income (€ Bn) | 1.2 | 1.2 - 1.3 | 1.3 | +8% |
| Net Debt (€ Bn) | ~16 | ~16 | ~15 | -€1Bn |
| FFO/ND % | ~19% | ~20% | ~22% | +3 p.p |
| DPS Floor (€ /share) | 0.20 | 0.20 | 0.21 | +5% |
This approach supports consistent performance, strengthens the balance sheet and preserves flexibility for future investment.
